
COGA Fact Sheet: The Colorado Molecule
The oil and natural gas molecules produced in Colorado are among the cleanest in the world. Under Colorado’s rigorous regulatory framework and environmental rules that are widely seen as the gold standard, Colorado companies are utilizing state-of-the-art technology and innovation to decrease emissions, reduce leaks, limit venting and flaring, and disturb less land. The end result is abundant, efficient and affordable energy sourced and produced locally in one of the safest and most environmentally sound manners anywhere. That matters, particularly if the alternative is relying on energy produced by countries with poor labor standards and environmental practices.

Innovations and Emission Reductions
Several of the innovations that have occurred along Colorado’s Front Range include but are not limited to: tankless production, low-bleed pneumatics, electric powered drill rigs, electric pumping engines, fence line and community air monitoring, water recycling, beneficial water reuse with industrial partners, solar PV and battery storage for monitoring and small pump operations, increased pipeline usage to reduce truck traffic, light mitigation, noise barriers, quiet hydraulic fracturing equipment, as well as community coordination to identify, plug, and reclaim old verticals wells to reduce cumulative emissions. These innovations and other emerging applications, while not possible in all circumstances, can improve operational efficiency and provide significant emission reductions that would otherwise lead to regional ozone formation and global climate change.
According to the International Energy Agency (IEA), “US emissions are now down almost 1 Gt from their peak in the year 2000, the largest absolute decline by any country over that period.” Part of that is due to fuel switching to natural gas, which is a low-carbon fuel. Most climate concerns about natural gas relates to methane emissions, but according to the EPA methane emissions are being reduced while production increases.
On a statewide basis, Colorado is making significant strides. Methane is emitted with volatile organic compounds (VOCs), which contribute to ozone formation, so controls to mitigate VOCs also mitigate methane, and provide both air quality and climate change benefits. From 2011 to 2020, Colorado’s oil and natural gas industry saw a nearly 60 percent reduction in emissions, with models out to 2023 projecting further decreases, particularly in the nonattainment area.
Venting and Flaring
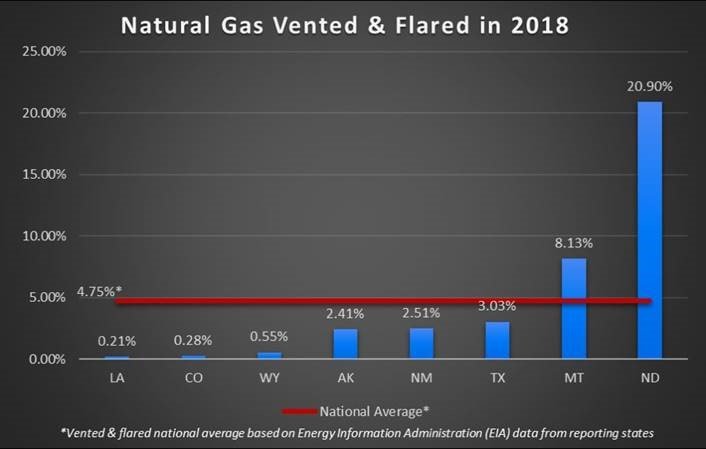
One way to reduce emissions is to reduce venting and flaring. Venting natural gas occurs for safety reasons, due to excess pressures, unless control equipment is installed onsite. Flaring is a common way to mitigate that venting and is accomplished by a controlled burn, reducing emissions that would otherwise be vented directly into the atmosphere. There is an economic incentive to limit venting and flaring, and in the charts above, it’s clear Colorado oil and natural gas operators are national leaders when it comes to keeping product in the pipe.
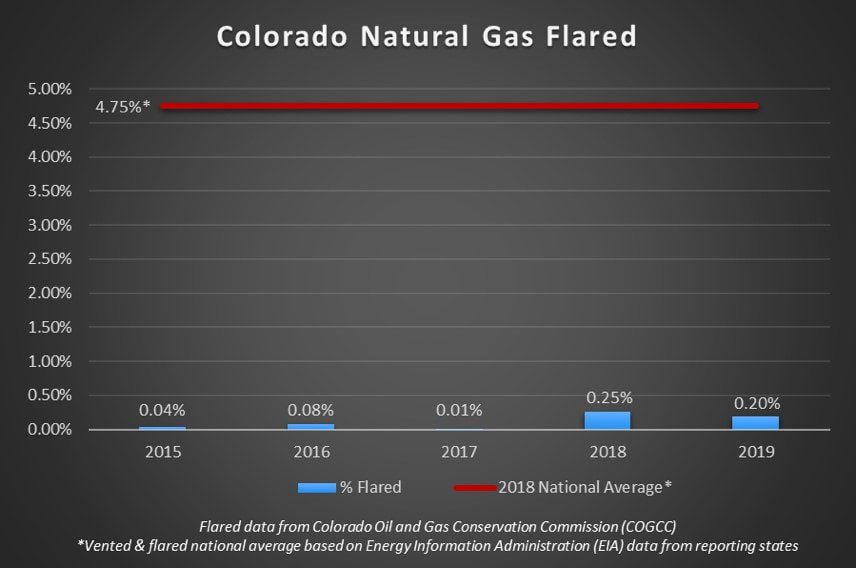
Looking at Colorado-specific flaring data between 2015-2019, local operators have maintained very low flaring rates. In fact, while the national average was 4.75 percent, Colorado oil and natural gas companies flared only 0.20 percent in 2019.
Leak Detection and Repair
Another way to reduce emissions is with strong leak detection and repair practices. Methane makes up 84 percent of leaks associated with oil and natural gas development, so detecting those leaks and fixing them quickly is important. In 2014, Colorado was the first state in the country to establish leak detection and repair requirements (LDAR), and according to the state health department, 3.35 million LDAR inspections at Colorado oil and natural gas locations occurred between 2014 and 2020. In fact, there were 552,544 inspections in 2020 alone, with leaks identified only 3.4% of the time. The frequency of LDAR inspections increased in 2019, 2020, and will be looked at again in 2021 through rulemaking.
Emissions Intensity
Another metric for understanding oil and natural gas emissions is by looking at emissions intensity. In short, this is calculated by dividing the CO2 equivalents (CO2e) produced per barrel of oil equivalent (BOE). It’s important to note that oil and natural gas formations are different from one another, and there are no apples-to-apples comparisons when using this metric.
Different geology, different depths, and different techniques required to develop the resource all come into play. However, the chart above lists the 10 resource basins with the lowest GHG emission intensities in the country. It confirms that the emissions intensity of the Denver-Julesburg (DJ) Basin is one of the lowest.

Energy Density
Energy density can be expressed as the amount of energy generated per acre, or the number of acres needed to produce one megawatt of energy, including related mining, transmission, capacity factors, and waste. Coal, nuclear, and natural gas all feature the smallest physical footprint of about 12 acres per megawatt produced. Solar and wind use 43.5 and 70.6 acres per megawatt respectively, and hydropower from large dams uses 315.2 acres per megawatt. Contemporary decision-making about constructing electric generation facilities rarely considers the value that comes from energy density. However, those technologies with a high energy density result in smaller surface impacts, and they allow for increased efficiencies with economies of scale.
Colorado Regulations
The State of Colorado is a national leader in its commitment to safe and responsible development of Colorado’s oil and natural gas resources. Over the past decade Colorado has implemented precedent-setting regulations from baseline groundwater testing and monitoring to air regulations targeting methane leak detection and repair. The rules are widely viewed as some of the most rigorous in the country and around the world.
Additional Resources & Information
Colorado Oil & Gas Conservation Commission (COGCC) | www.cogcc.state.co.us
COGA Fact Sheets: Economic | www.coga.org/factsheets/category/economic
COGA Fact Sheets: Regulations | www.coga.org/factsheets/category/regulations