
COGA Fact Sheet: Air Quality Advancements
Protecting the air we breathe is one of Colorado’s oil and natural gas industry’s highest priorities. This commitment to preserve the state’s air quality has resulted in VOC emissions decreasing by nearly 50% between 2011 and 2017, even as production quadrupled. In fact, the Regional Air Quality Council (RAQC) and the Colorado Department of Health and Environment (CDPHE) found that “new regulations and advancements in technology” have resulted in significant emission reductions.
Colorado Leads the Nation

Regulated methane emissions from oil and natural gas production have reduce more than 60,000 tons of methane emissions per year.
Comprehensive leak detection and repair practices for oil and natural gas facilities.
Control and inspection requirements for storage tanks ensure tank emissions are captured and routed to the required control devices.
Examples of Efforts that Reduce Emissions
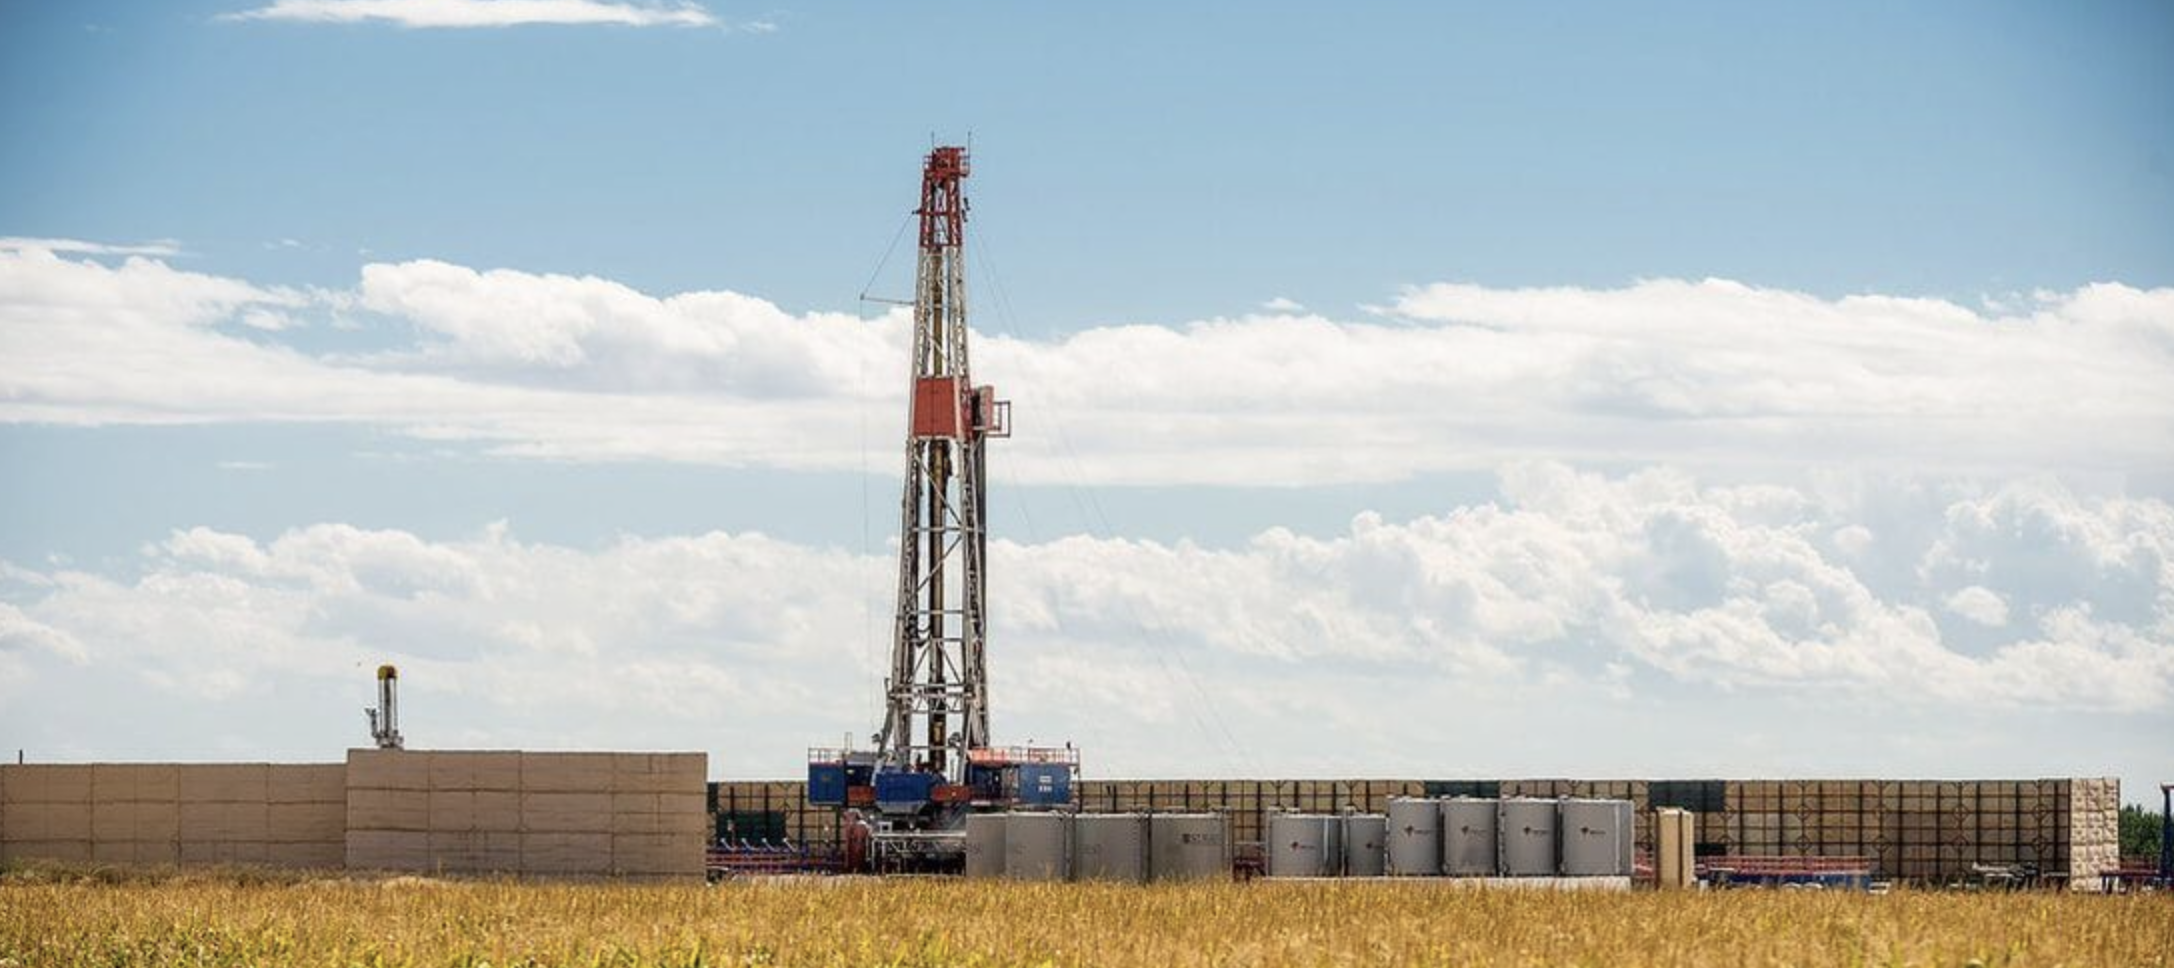
Use of electric-powered drilling rigs instead of diesel-powered rigs.
Electric power used to run production facilities throughout the life of the well where feasible.
Pipelines instead of trucks to transport oil and water, reducing site emissions and eliminating on average 40,000 truck trips and millions of truck miles per pad over 30 years.
Use of closed-loop systems that are airtight and designed to reduce emissions.
Removal and reclamation of thousands of legacy wells and facilities, removing outdated technology.
Inspection & Monitoring Programs
Regular inspections and record keeping throughout the life of the well.
Consistently performing Leak Detection and Repair (LDAR) inspections using infrared cameras that detect emissions invisible to the human eye. Since 2014, when Colorado began LDAR monitoring, the industry has carried out nearly 2.2 million of these inspections across the state.
Engineering Improvements
Use of low bleed pneumatic controllers (this releases significantly less methane into the air).
Internal Floating Roof (IFR) tanks for control and storage of pressurized oil at gathering facilities (this provides minimum vapor loss into the environment).
Vapor capture technology applied at some facilities.
Improving Air Quality While Production Soars
Technical innovation and strict regulations have resulted in Colorado consistently experiencing fewer poor air quality days – all while oil and natural gas production in the state has nearly quadrupled over the last decade.

Additional Resources & Information
Colorado Department of Public Health & Environment (CDPHE) | www.colorado.gov/cdphe
Regional Air Quality Council (RAQC) | www.raqc.org
Colorado Oil & Gas Conservation Commission (COGCC) | www.cogcc.state.co.us
US Environmental Protection Agency (EPA) | www.epa.gov
EPA Air Quality System | www.epa.gov/aqs