• Programs & Events
    • Event Calendar
    • The Energy Summit
    • COGA Programs
  • Community
    • Community Impact Report
    • Colorado Energy Foundation
  • News & Information
    • News & Media
    • Climate & Emissions >
      • Climate & Energy Transition
    • Fact Sheets >
      • CO Oil & Gas Resource Guide
      • Useful Links
  • Get Involved
    • Take Action >
      • COGA PAC
  • About COGA
    • COGA Board
    • COGA Staff
    • Jobs
    • Membership >
      • COGA Committees
      • Join COGA
      • Login
      • Membership Directory
Colorado Oil and Gas Association
  • Programs & Events
    • Event Calendar
    • The Energy Summit
    • COGA Programs
  • Community
    • Community Impact Report
    • Colorado Energy Foundation
  • News & Information
    • News & Media
    • Climate & Emissions >
      • Climate & Energy Transition
    • Fact Sheets >
      • CO Oil & Gas Resource Guide
      • Useful Links
  • Get Involved
    • Take Action >
      • COGA PAC
  • About COGA
    • COGA Board
    • COGA Staff
    • Jobs
    • Membership >
      • COGA Committees
      • Join COGA
      • Login
      • Membership Directory

COGA Fact Sheets

COGA Fact Sheets are designed and created as easy to understand, quick reference informational tools on specific topics as they relate to Colorado's oil and natural gas industry and operations ranging from health, safety, air, community, and economic impacts. Click any topic in the Fact Sheet Index below to learn more.
COGA Fact Sheet

Industry Safety

1/8/2020

1 Comment

 
Picture
Published: 10/2/2019
​Colorado oil and natural gas operators are an integral part of one of the safest industries in the country. Over the past decade, the oil and natural gas industry’s incident rate has decreased by 41 percent, while doubling the size of its workforce and increasing overall production and the number of drilling rigs.
​The U.S. Bureau of Labor Statistics found that working in the oil and natural gas industry is on average, safer than the construction and manufacturing industries, hospitality, educational and health services, and even state government.
In 2017, the rate of job-related injuries and illnesses for the oil and natural gas industry was 1.7 per 100 full-time workers compared to a rate of 2.8 for the entire U.S. private sector. Even as the U.S. average occupational incident rate rose to 3.1 in 2018, the oil and natural gas industry rates dropped to 0.8 per 100 full-time workers, and have continued to decline year over year.
Picture

Incidence Rates of Occupational Injuries by Industry

The Survey of Occupational Injuries and Illnesses (SOII) presents estimates of counts and incidence rates of employer-reported workplace injuries and illnesses by industry and type of case, as well as detailed estimates of case circumstances and worker characteristics for cases that resulted in days away from work. According to the BLS Report, there were 2.8 million nonfatal workplace injuries and illnesses reported in the United States by private industry employers in 2018, unchanged from 2017.
Picture

Industry's Commitment to Safety

Prevention
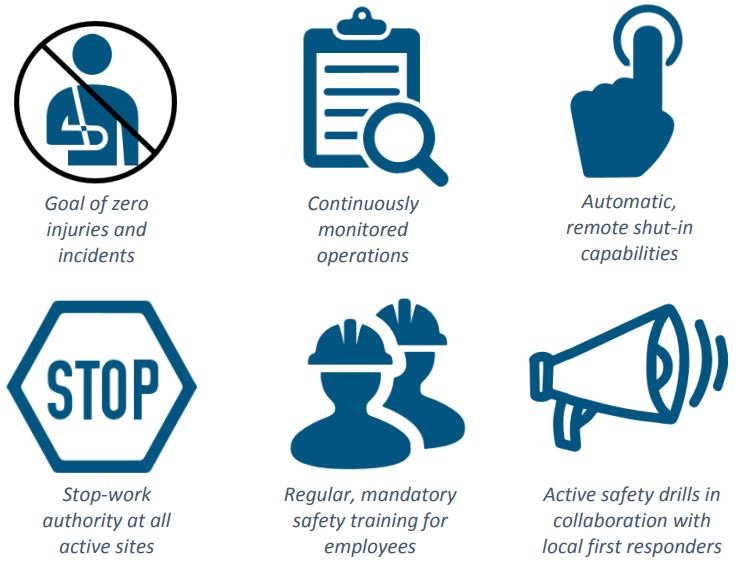
  • Operations are intentionally designed to reduce the risk of injury and incident.
  • Many operations are monitored 24/7 and are designed to automatically shut in remotely, further preventing risk of injuries and incidents.
  • Anyone who comes on an active site has stop-work authority if they see anything unsafe occurring.
Training
  • Colorado employees attend regular, mandatory safety training sessions.
  • Operators conduct spontaneous safety drills in coordination with local responders to ensure everyone has the skills and confidence to effectively 
Picture
Training
  • Through innovation, applied learnings and tailoring operations in ways that benefit communities and improve the safety of employees.
  • Applying best safety practices and train employees on incident prevention.
  • Serving as a resource to community first responders on incident responses.
  • Engaging in active campaigns like Colorado811 to educate excavators and the general public on the industry’s underground infrastructure of pipelines to avoid incident and injury.

Additional Resources & Information

American Petroleum Institute (API) | www.api.org
United States Department of Labor (BLS) | www.bls.gov
Download This Fact Sheet
Back to COGA Fact Sheets
COGA Fact Sheet footer
1 Comment
Sarah Smith link
12/22/2020 05:33:12 pm

Thanks for the information that pipeline projects are monitored 24/7. I think we need to get a pipeline built to our new cabin. We'll start looking for a pipeline service in our area.

Reply

Your comment will be posted after it is approved.


Leave a Reply.

    Picture

    Categories

    All
    Air & Ozone
    Economic
    Flowlines
    Health
    Oil & Gas 101
    Policy
    Regulations
    Safety
    Water

    RSS Feed

Colorado Oil & Gas Association.  All Rights Reserved.
1800 Glenarm Place, Suite 1100  |  Denver, CO 80202
Phone: (303) 861-0362 | info@coga.org | sitemap
COGA Logo
  • Programs & Events
    • Event Calendar
    • The Energy Summit
    • COGA Programs
  • Community
    • Community Impact Report
    • Colorado Energy Foundation
  • News & Information
    • News & Media
    • Climate & Emissions >
      • Climate & Energy Transition
    • Fact Sheets >
      • CO Oil & Gas Resource Guide
      • Useful Links
  • Get Involved
    • Take Action >
      • COGA PAC
  • About COGA
    • COGA Board
    • COGA Staff
    • Jobs
    • Membership >
      • COGA Committees
      • Join COGA
      • Login
      • Membership Directory